Warning: Zend OPcache API is restricted by "restrict_api" configuration directive in /srv/users/serverpilot/apps/goldoildrugs/public/wp-content/plugins/tubepress/vendor/tedivm/stash/src/Stash/Driver/FileSystem.php on line 253
Warning: Zend OPcache API is restricted by "restrict_api" configuration directive in /srv/users/serverpilot/apps/goldoildrugs/public/wp-content/plugins/tubepress/vendor/tedivm/stash/src/Stash/Driver/FileSystem.php on line 253
Quotes of the day:
Stay beautiful stay off drugs -Johnny Wowk AKA Johnny The Walker
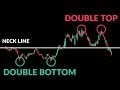
A double bottom pattern is a technical analysis charting pattern that describes a change in trend and a momentum reversal from prior leading price action. It describes the drop of a stock or index, a rebound, another drop to the same or similar level as the original drop, and finally another rebound. The double bottom looks like the letter W. The twice-touched low is considered a support level.
How to Trade Double Tops and Bottoms


We uses YouTube API Services.
Click to rate this post!
[Total: 0 Average: 0]