Warning: Zend OPcache API is restricted by "restrict_api" configuration directive in /srv/users/serverpilot/apps/goldoildrugs/public/wp-content/plugins/tubepress/vendor/tedivm/stash/src/Stash/Driver/FileSystem.php on line 253
Warning: Zend OPcache API is restricted by "restrict_api" configuration directive in /srv/users/serverpilot/apps/goldoildrugs/public/wp-content/plugins/tubepress/vendor/tedivm/stash/src/Stash/Driver/FileSystem.php on line 253
Quotes of the day:
First responders did not find any drug paraphernalia or illegal drugs at the residence, the cause of death into Jackson Odell is pending an autopsy and toxicology report.
A line chart is a graphical representation of an asset’s historical price action that connects a series of data points with a continuous line. This is the most basic type of chart used in finance and typically only depicts a security’s closing prices over time. Line charts can be used on any timeframe, but most often using day-to-day price changes.
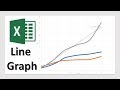
How to Make a Line Graph in Excel


We uses YouTube API Services.
Click to rate this post!
[Total: 0 Average: 0]