Warning: Zend OPcache API is restricted by "restrict_api" configuration directive in /srv/users/serverpilot/apps/goldoildrugs/public/wp-content/plugins/tubepress/vendor/tedivm/stash/src/Stash/Driver/FileSystem.php on line 253
Warning: Zend OPcache API is restricted by "restrict_api" configuration directive in /srv/users/serverpilot/apps/goldoildrugs/public/wp-content/plugins/tubepress/vendor/tedivm/stash/src/Stash/Driver/FileSystem.php on line 253
Quotes of the day:
Not all treasure is silver and gold, mate.
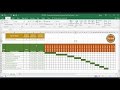
A Gantt chart is a graphical depiction of a project schedule. It’s is a type of bar chart that shows the start and finish dates of several elements of a project that include resources, milestones, tasks, and dependencies. Henry Gantt, an American mechanical engineer, designed the Gantt chart.
Gantt Chart Excel Tutorial - How to make a Basic Gantt Chart in Microsoft Excel 2013

We uses YouTube API Services.
Click to rate this post!
[Total: 0 Average: 0]