Warning: Zend OPcache API is restricted by "restrict_api" configuration directive in /srv/users/serverpilot/apps/goldoildrugs/public/wp-content/plugins/tubepress/vendor/tedivm/stash/src/Stash/Driver/FileSystem.php on line 253
Warning: Zend OPcache API is restricted by "restrict_api" configuration directive in /srv/users/serverpilot/apps/goldoildrugs/public/wp-content/plugins/tubepress/vendor/tedivm/stash/src/Stash/Driver/FileSystem.php on line 253
Quotes of the day:
I wouldn\'t recommend sex, drugs or insanity for everyone, but they\'ve always worked for me.
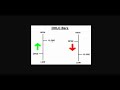
An OHLC chart is a type of bar chart that shows open, high, low, and closing prices for each period. OHLC charts are useful since they show the four major data points over a period, with the closing price being considered the most important by many traders.
How to Create Flutter Financial Charts like Candle and OHLC in 10 Minutes
We uses YouTube API Services.
Click to rate this post!
[Total: 0 Average: 0]